An important question that may arise for researchers is how to evaluate the impact of their research papers. Basically, bibliometric studies are used as a tool for evaluating the impact of scientific publications. A very popular field of study for measuring the research impact is called Scientometrics. There are various metrics and methods utilized for measuring the research bibliometric impact of scientific authors, some of which are mentioned below.
1. Citations:
This metric, which is widely used for evaluating the publication impact of researchers, indicates the total number of citations received by publications of a researcher.
2. Citations/documents:
The number of citations received by published documents of a researcher divided by the total number of published documents. In fact, citations/document is the number of publication citations of a researcher normalized by his/her publications volume. This index can be calculated and evaluated in different time periods (e.g. the last 5 years, the last 2 years, etc.) indicating the impact of the papers over time.
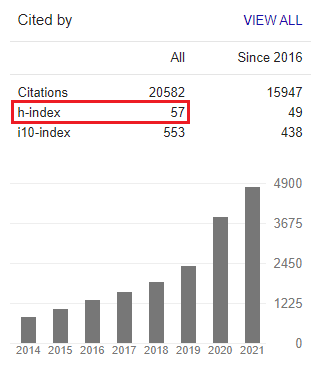
3. H-Index:
This metric indicates the number of papers published by a researcher, h, that have been cited at least h times. H-index, introduced by J.E. Hirsch in 2005 [1], is one of the most widely used author-level metrics that quantifies an author publication impact by considering the citation and volume of research works. You can find an author’s h-index in Google Scholar, Web of Science, and Scopus. It is to b noted that the h-index should not be utilized as an indicator for comparing the rank of researchers who are in different disciplines.
4. Normalized h-index:
This indicator is found by simply normalizing the h-index of an author by the average h-index of all authors in a specific field of study. The normalized h-index allows the comparison of researchers working within different disciplines. The normalized h-index, unlike the h-index, can be regarded as a universal scholarly impact metric.
5. M-index:
This metric is the normalized h-index by publication years of an author. The m-index is calculated by dividing the h-index of a scholar by the number of years since the first published document of that scholar.
6. I-10 index:
This index shows the number of publications of an author with at least 10 citations. The I-10 index was introduced first by Google in 2011, and it is still used as an author-level metric in Google Scholar.
7. G-index:
The G-index is the first g papers of an author (sorted by highest to lowest number of citations) that have received cumulatively at least g*g citations [4]. unlike the h-index, the g-index is unequivocally influenced by highly-cited published papers. This scholarly impact metric was first introduced in 2006.
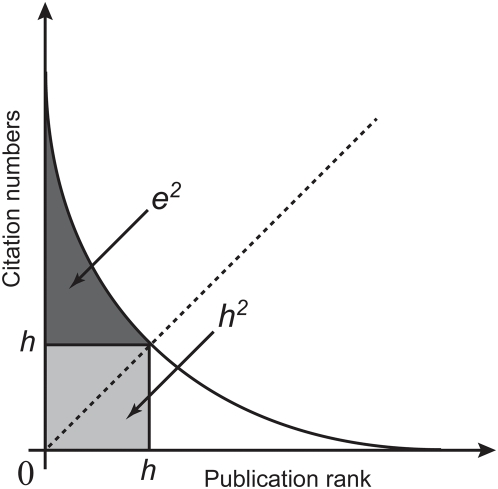
8. E-index:
Not all citations of an author publication are taken into account when calculating the h-index. In fact, the citations that exceed the h-core are totally ignored (look at the following graph). The e-index is introduced to complement the h-index for ignored citations [5]. This metric is suitable for comparing the performance of authors’ publications with the same h-index.
9. Impact Factor:
Author Impact Factor (AIF) indicates the mean number of citations received by publications of an author in a year.
10. RG score:
RG score which stans for ResearchGate score is an author-level metric proposed by ResearchGate in 2012 [1]. A lot of factors including the scientific and social activities of researchers affect their RG score. One can increase his/her RG score by sharing research work with other RG colleagues, asking and answering questions, uploading new search items, creating projects, attracting more followers, etc.
11. FWCI:
Field-weighted Citation Impact (FWCI) is another author performance metric introduced by SciVal [3]. FWCI is a discipline-normalized indicator which means it takes disciplinary differences into account and so can be used as an indicator for comparing the rank of researchers who are in different fields of study and disciplines.
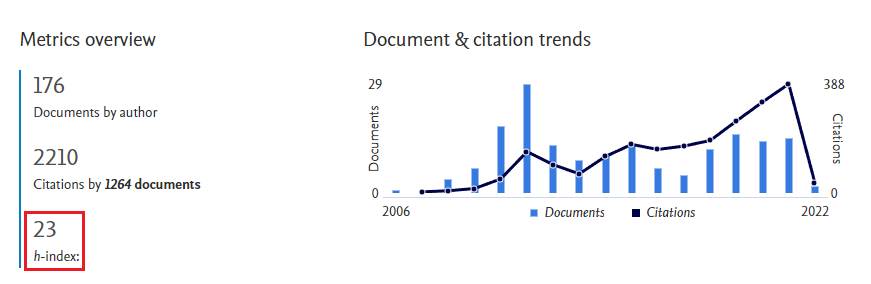
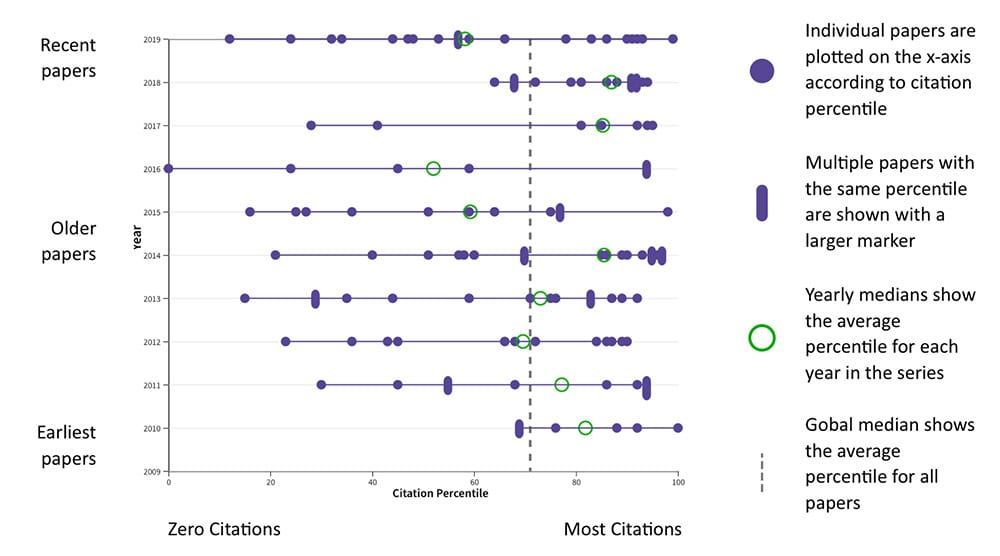
12. Beamplot:
Beamplot is not a metric but a method indicating citation and volume impact of a researcher’s publication over time (the figure below) [2].
References:
[1] https://thenextweb.com/news/researchgate-introduces-rg-score-like-klout-boffins
[2] Hirsch JE. An index to quantify an individual’s scientific research output. Proc Natl Acad Sci U S A. 2005 November 15; 102(46): 16569–16572.
[3] https://libguides.usc.edu.au/researchmetrics/researchmetrics-field-weighted-citation-impact
[4] Egghe, Leo (2006). “Theory and practise of the g-index”. Scientometrics. 69 (1): 131–152.
[5] Zhang, Chun-Ting (2009). Joly, Etienne (ed.). “The e-Index, Complementing the h-Index for Excess Citations”. PLOS ONE. 4 (5): e5429.